Targeted Privacy Attacks by Fingerprinting Mobile Apps in LTE Radio Layer
Jaejong Baek Arizona State University Tempe, AZ, USA jaejong@asu.edu
Pradeep Kumar Duraisamy Soundrapandian Vellore Institute of Technology Chennai, Tamilnadu, India pradeepkumarst@gmail.com
Sukwha Kyung Arizona State University Tempe, AZ, USA skyung1@asu.edu
Ruoyu Wang Arizona State University Tempe, AZ, USA fishw@asu.edu
Yan Shoshitaishvili Arizona State University Tempe, AZ, USA yans@asu.edu
Adam Doupe´ Arizona State University Tempe, AZ, USA doupe@asu.edu
Gail-Joon Ahn Arizona State University Tempe, AZ, Country gahn@asu.edu
Abstract—We investigate the feasibility of targeted privacy attacks using only information available in physical channels of LTE mobile networks and propose three privacy attacks to demonstrate this feasibility: mobile-app fingerprinting attack, history attack, and correlation attack. These attacks can reveal the geolocation of targeted mobile devices, the victim's app usage patterns, and even the relationship between two users within the same LTE network cell. An attacker also may launch these attacks stealthily by capturing radio signals transmitted over the air, using only a passive sniffer as equipment. To ensure the impact of these attacks on mobile users' privacy, we perform evaluations in both laboratory and real-world settings, demonstrating their practicality and dependability. Furthermore, we argue that these attacks can target not only 4G/LTE but also the evolving 5G standards.
Index Terms—LTE, 4G, Fingerprinting, Privacy, Cellular, Machine Learning
I. INTRODUCTION
Mobile communication signals permeate the airwaves as the number of devices and users increases while an average user spends almost 4 hours on their mobile devices every day [1]. Information that we send across these airwaves and the mobile applications with which we send it discloses intimate details about our lives, relationship statuses, sexual preferences, political views, and much more. These revelations can be so sensitive that even the disclosure of an installed app on a user's phone can have significant personal and professional repercussions [2]. With the unprecedented and continuing growth of mobile networks, the protection of mobile user privacy is more pressing than ever.
One approach to protecting mobile user privacy is network traffic encryption, such as Transport Layer Security (TLS) protocol. While TLS protects the contents of application traffic, research has shown that an attacker can reliably identify which mobile applications are in use by monitoring and fingerprinting unencrypted metadata in TLS traffic, such as destination IPs, destination ports, and TLS certificates [3]. Fortunately, modern mobile communication standards, such as Long-Term Evolution (LTE), encrypt even this data in the air interface (the radio layer) [4]. This means that previously-proposed attacks will only work when the attacker can access either the victim's mobile device or the base station the victim's device is connected to, where the attacker can sniff and analyze the transport layer traffic that is not protected by LTE encryption. In this case, compromising cell phones or breaking into base stations can be challenging in the real world. However, is this really necessary?
In this paper, we demonstrate that the physical channel of LTE alone is sufficient to carry out previously-proposed privacy attacks to identify which mobile applications are in use on a device. Because our attacks function on the physical layer of LTE, they can be carried out through self-deployed sniffers directly on the exact traffic transmitted in the air, and do not require physical or logical access to user equipment or network nodes. They also do not require the cooperation of mobile vendors. Worse, these techniques scale with the number (and coverage) of deployed sniffers, and by correlating the use of messaging applications between different devices, we could detect communication between targeted users. The capabilities that we describe in this paper allow an adversary with moderate resources, such as a nation-state or a local police department, to identify the pre-trained apps used by and detect communication links between targeted users, on a city-wide scale and with a reasonable success rate, using undetectable techniques.
To function on the physical layer of LTE, our attack cannot depend on techniques used by previous work, such as the analysis of IP addresses, ports, domain names, or TLS certificates. Instead, our mobile application fingerprinting framework uses physical-level information (e.g., transport block sizes) in wireless traffic to fingerprint mobile applications used by a victim. Using a labeled dataset collected by our framework, we trained a machine learning model to classify traffic and predict mobile applications that are in use. To ensure the practical feasibility of the proposed attacks in the real world, we assess the variables that affect the performance of the attacks, including changes in performance over time, the impact of multiple apps, and LTE handover. Based on this capability, we propose three privacy attacks against targeted mobile users: A mobile-app fingerprinting attack, a history attack that reveals the history of a user's mobile application usage, and a correlation attack that reveals the relationship between any two mobile users.
We evaluated our attack in both laboratory and real-world settings. Our dataset consists of a total of 350,521 traffic traces recorded over six months, including 220,278 traces recorded in a lab setting and 130,243 live network traces in a real-world setting across three major US mobile networks. In the real world, our mobile-app fingerprinting attack achieved F-Scores of 74% to 91%; Our history attack achieved an 83% success rate, and our correlation attack showed varied but promising results, reaching up to 100% precision rates for certain classes of communication. Finally, we estimate the attack costs that an attacker needs to exert for continuous monitoring and deduce that the attacker can perform the same level of app fingerprinting and privacy attacks as a large organization.
Our attacks provide new insights into the vulnerability of LTE standards to side-channel attacks and potential directions for the security of LTE traffic. Because the evolving 5G standard suffers from similar weaknesses, we as a community must move quickly to address such weaknesses early. Our paper makes the following contributions:
- Physical-layer mobile application fingerprinting. We propose a mobile-app fingerprinting attack using only data available in LTE physical channels. This attack can be carried out by self-deployed sniffers, at scale, and cannot be detected by victims.
- Two novel privacy attacks in LTE networks. Atop the classification model, we propose two novel targeted privacy attacks (history attack and correlation attack), which allow attackers to reveal the specific mobile users' app usage patterns, locations, and even the relationship between users.
- Real-world evaluation. We evaluate our proposed attacks in both laboratory and real-world settings. Our attacks show high accuracy and reliability in both environments.
In the spirit of open science, we publicly release our labcreated dataset, the trained model, and the source code of our attack framework upon publication.1
II. BACKGROUND
A. Overview of LTE Networks
As shown Figure 1, LTE networks are comprised of three main components: user equipment (UE), evolved Node B (eNB), and evolved packet core (EPC). The UE provides endusers with access to cellular services. An eNB is a base station that provides a radio connection to the UEs. An EPC is a network that manages user registration and mobility. Multiple identifiers are broadcast to UEs to ensure proper data delivery via the unencrypted physical channel exposed to the public.
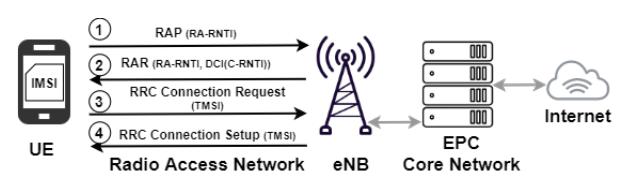
Fig. 1: LTE Architecture and RRC Connection Procedure.
A Radio Network Temporary Identifier (RNTI) is assigned to the UE by the eNB (②) using the DCI (Downlink Control Information) message, and a Temporary Mobile Subscriber Identity (TMSI) is assigned by the EPC (④). By assigning RNTIs to connected UEs, the eNB differentiates the user from other connected users. Similarly, TMSIs are unique identifiers assigned by the EPC when UEs are registered in LTE networks; they are limited to the context of the serving eNB. When UEs move to new cells, the TMSIs will no longer be valid. An eNB communicates scheduling information to its connected UEs through DCI messages that are carried within a Physical Downlink Control Channel (PDCCH) which is an unencrypted channel. While the actual traffic is sent over dedicated channels in encrypted forms, e.g., the Physical Uplink Shared Channel (PUSCH) and the Physical Downlink Shared Channel (PDSCH), PDCCH transmits DCI messages in plain text, which makes these messages trivially decodable.
To collect specific users' traffic only, it is essentially necessary to know the RNTIs of the UE. The RNTI may change randomly, however, based on network policies or UE activity. For instance, to save power and network resources, a UE enters "idle mode" if no data is transmitted between the UE and its eNB for a threshold of time (default 10s). When eNB sends a paging call to the idling UE, the UE will switch to "connection mode", reconnect to the eNB, and receive a new (usually, different) RNTI from eNB. Thus, the validity of an RNTI depends in part on the application-layer protocol of mobile apps [12]. The longer a mobile app transmits data and keeps the UE in connection mode, the longer its RNTI will stay valid.
B. Known Privacy Attacks in Mobile Networks
Mainly privacy attacks in mobile networks have been covered in terms of identity mapping, location leaking, and Web fingerprinting using side-channel information on man-in-themiddle or locally-intercepted traffic.
UE Identity Mapping. International Mobile Subscriber Identity (IMSI) is the permanent unique number of mobile subscribers. IMSI catching is a well-known attack aiming to reveal the number stored inside UE [13], [14]. This process can be done passively and actively, but the passive opportunity to do so is barely rare. In most cases, it relies on an active attacker, such as a fake base station [15] or an overshadowing attack [16] that requires sending messages to the victims and IMSI Extractor [17] using the undetectable low-power message overshadowing with sniffers. Also, TMSIs and RN-TIs can be leaked by decoding the sniffed traffic over the
1https://github.com/sefcom/LTE-fingerprint
TABLE I: Comparison of network fingerprint attacks (⃝: supported, X: unsupported, △: partially).
| Capabilities | Wired [5], [6] |
Wi-Fi [7], [8] |
LTE [9]–[11] |
Ours (LTE) |
Our Approach |
|---|---|---|---|---|---|
| Physical layer fingerprints | X | ⃝ | △ | ⃝ | Decoding Physical Channel (section IV) |
| Multiple categories classification | ⃝ | ⃝ | X | ⃝ | 3 Classes: Streaming, Mobile VoIP, IM apps classification (section VI) |
| Targeted privacy attacks | X | △ | X | ⃝ | History attack(section VII-B), Correlation Attack (section VII-C) |
| Real-world evaluation | ⃝ | ⃝ | △ | ⃝ | U.S. major Mobile Network Operators (MNOs) (section VII-A) |
air. Both are temporary identification numbers and normally TMSI is much longer-lived than RNTI. The feasibility of the mapping between permanent and temporary IDs allows an adversary to reveal the subscriber's identity, which is called an identity mapping attack. The first identity mapping attack was proposed by matching passively RNTI and TMSI in Random Access Channel (RACH) procedure [11]. The attacker learns the identity of a user by eavesdropping on the connection establishment procedure, which is not detectable and completely passive, and which is a building block of our approach. In a different attack, Kohls et al. [10] proposed actively injecting watermarks in the traffic to identify the traffic of the specific user. Typically, an identity mapping attack serves as a stepping stone for the targeted attack [18] which allows the adversary to identify and track the specific user within a cell for gathering the critical data (or traffic) in a stealthy manner.
Location leaks. Due to the prevalence of the cellular network, the geographic location tracking of the mobile subscriber is a common research interest, as intercepting the victim's paging channel and calling or texting the victim to invoke paging messages. The radio signal also leaks the tracking area code, received power threshold to trigger a handoff to an adjacent cell, and a series of configuration parameters that could be leveraged to configure a rogue base station [19], [20]. Additionally, the timing advance parameter in the signaling plane is also used for location-based attacks [21].
Traffic Fingerprints Research on traffic fingerprinting and classification has been extensive, ranging from the first attacks on Secure Socket Layer (SSL) traffic in 1998 by Cheng et al [22] to the latest deep learning attacks on website traffic [3], [6], [23]–[25]. Table I shows comparisons of prior network fingerprint attacks performed on the wired, Wi-Fi, and LTE networks. The patterns of our collected traffic are highly similar to the transmission and encryption characteristics of HTTP and TCP/IP protocols.
While a dataset of encrypted website fingerprints is available [3], [23], [24], there is little LTE traffic dataset collected at the physical channel for fingerprinting. Therefore, we create these datasets by collecting LTE traffic via the physical channels in a lab setting and real-world setting.
C. Targeted Attacks
A targeted attack is a type of dedicated attack that aims at a specific user or group to gain access to critical data in a stealthy manner [18]. Our attack is aligned with the characteristic of targeted attacks, which is intended for pursuing specific victims the attacker is interested in and obtaining critical data in a hidden manner. Also, the attackers may wait for the appropriate opportunity to execute the devised attack.
D. Related work
Bae et al. [9] performed a video identification attack to identify mobile users who are watching specific videos and predict the video title that each of these users watches by leveraging fingerprinting the labeled datasets in LTE networks. Their attacks achieved a high accuracy against video streaming. However, the performance and scalability of the attack could be limited to the detection with the known video stream traces. Kohls et al. [10] investigated a passive fingerprinting attack and an active identity-mapping attack on encrypted LTE/4G layer-two traffic in the private lab and commercial network. They inject specific letter patterns into the mobile app to generate a specific signal pattern, which makes it impractical in the real world due to the detection of the user which leads to the blocking of the apps. Subsequently, Rupprecht et al. [11] presented an LTE layer two security analysis and introduce a passive identity mapping attack and website fingerprinting attacks. However, they limited the scope of the capability to fingerprint the website within experimental data and provided proof-of-concept. Thus, a commercial network test for practicality is limited. As summarized in Table I, our approach is not the first attempt at fingerprinting the LTE traffic, nor the first to propose privacy attacks. However, compared with previous work, we extend its targeted privacy attacks to derive the user's history of activity and relationship with other callers in a passive manner. Also, we focus on the practicality of the attacks with various vectors based on real-life scenarios such as asynchronous sessions, background traffic noise, handovers, and the attack cost.
III. OVERVIEW
A. Threat Model
To determine the targeted victim, we assume that an attacker may profile the victims based on Open Source Intelligence (OSINT), such as social network accounts or websites providing individual information. Also, the attacker may stay in the victim's physical cell and access the cell coverage.
We assume that the attacker's sniffer is pre-installed within the target range of an LTE cell/eNB (or several sniffers within the range of several LTE cells) that victims are connected to. The sniffer also supports the LTE radio cell scanning feature to search the specific frequency (channel) and MNO information used for targeting the victim. All other attacker's capabilities derive from this requirement. By fulfilling the requirement, the attacker can collect wireless messages from a sole downlink or
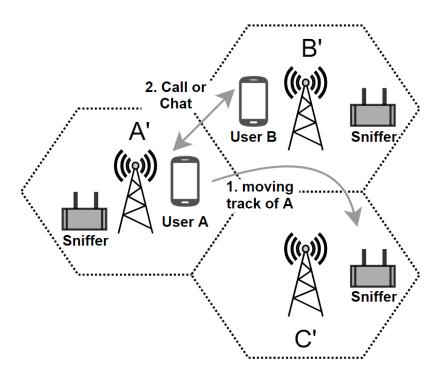
Fig. 2: Examples of history attack and correlation attack.
uplink channel with one sniffer. If an attacker wants to collect wireless messages from multiple N channels, N sniffers are required.
In this way, the attacker collects and analyzes "traces" (that is, physical channel metadata) of a victim's LTE communications to identify apps on the victim's mobile device and perform the aforementioned privacy-infringing attacks. The attacker can transfer the collected traces for offline analysis, whether to a cloud or private computing center for a pretrained model to analyze the data. In addition, the attacker can launch attacks in a stealthy manner remotely, using their own multiple devices and their own infrastructure. These requirements are easy to be satisfied for common people at an affordable cost (500 to 1,000 USD per Software Defined Radio (SDR)-based sniffer), plus computing power).
B. Attack I. Mobile Apps Fingerprinting Attack
Our mobile app fingerprinting attack is the foundation of the next two privacy-infringing attacks. It first begins with data collection: recording the victim's RTNI, IMSI, and radio traffic between the victim's UE and the eNB. The attacker can then use a pre-trained classifier to identify application fingerprints in the data, matching individual users to the applications used. Over the entire process, the attacker does not need to break any encryption or actively compromise any devices or infrastructure (such as the victim's cellphone or any base stations). All that is required is a passive sniffer, which allows the attack to be extremely stealthy, and off-the-shelf physical channel LTE parsing routines.
C. Attack II. History Attack
The mobile app fingerprinting attack allows an attacker to deduce which apps a user (victim) is running at any specific time. By analyzing all LTE traffic of a victim over a certain period of time, we can recognize the app usage patterns of this victim. Since prior work allows us to associate the victim's UE and all random RNTIs that eNBs assign to it [26], [27], we will then be able to reveal the victim's movement history together with their app usage patterns.
Figure 2 exemplifies a history attack on User A, who is staying within or moving between (roaming or handing over) cell zones of the same mobile operator. User A frequently moves between Cell Zone A' (their home), Cell Zone B' (their workplace), and Cell Zone C' (a grocery store). An attacker has pre-installed traffic sniffing devices in these cell zones and can continuously trace RNTIs of the victim's UE across zones (i.e., handover between cells) using an IMSI catcher [13], or perform identity mapping attack [11] described in Section III-E. By launching the history attack, the attacker will reveal the victim's movement history and their app usage in each location cooperatively.
D. Attack III. Correlation Attack
Since capturing messages in the LTE physical channel is easy and affordable cost, we extend our attack to multiple victims and propose a correlation attack: Based on application usage patterns that two UEs have at the same time, an attacker may infer the relationship between the victims without having any prior knowledge of the victims or their app usage patterns. When two users communicate with each other using the same app, their LTE traffic patterns could be similar. If traffic patterns of two UEs correlate, we can learn that their users may be related in some way. For example, User A and User B in Figure 2 chat with each other on a messaging platform. An attacker could infer their relationship (based on communication) and level of intimacy (based on the application used to communicate) by launching a correlation attack.
We leverage correlation analysis to predict the interrelationships between users' traffic patterns. Correlation analysis is a statistical method for measuring the strength of a relationship. We collect network traffic of mobile apps for each pair of User A and B and generate graphs with respect to the number of frames. With the help of pre-trained app fingerprints, we can identify apps in use and the exact type of application (e.g., VoIP calls, video streaming, etc.), and then extract traffic patterns from the traffic. By calculating the similarity between traffic patterns, we discover the degrees (similarity scores) of the relationship between two victims.
E. Overview of the Attack Framework
Figure 3 illustrates the high-level procedures of the proof-ofconcept framework that we built for the proposed attacks. Our framework enables an over-the-air, automated, and detailed traffic profiling in LTE physical channels, and implements LTE physical-channel-based mobile app fingerprinting attack as four procedures: identity mapping, data acquisition, data pre-processing, training, and classification.
➊ Target Identity Mapping. First, a target identity mapping is to match RNTI to TMSI or IMSI, enabling us to identify users within a cell and serving as an important prerequisite step for performing the extended privacy attacks in terms of collecting the traffic of specific apps of the user continuously. We leverage the prior passive method [11] to map the RNTI to the TMSI by exploiting the contention-based resolution identity of the RRC connection setup message as shown in Figure 1. To this end, we first collect and maintain a list of active RNTIs using open-source software OWL [28] which identifies UEs
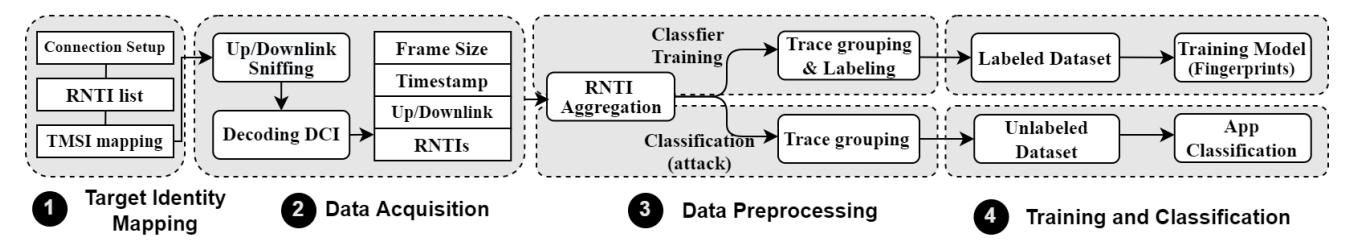
Fig. 3: Overview of the proof-of-concept framework for fingerprinting mobile apps using LTE physical channel messages
within a given cell. Although the RNTIs are refreshed by the eNB, we can detect its changes and correctly associate the UEs by decoding the corresponding DCI (Downlink Control Information) records with CRC bit masking over time using this method. Alternatively, to map TMSI to the persistent identifier (IMSI), we could also consider the existing active methods [13], [29], [30] mentioned in Section II-B, which inject watermarks in the traffic or perform man-in-the-middle attacks. Once we adopt and employ them, our attacks are not entirely performed with a passive sniffer in this step anymore. If we would insist on the passive mode in the attack, our attack supports only mapping to a TMSI passively.
- ➋ Data acquisition. Next, the framework sniffs LTE data off the airwaves to decode DCI messages to obtain the raw data that will be used in the attack.
- ➌ Data preprocessing. Next, the framework generates traces based on decoded RNTIs and sorts traces by the user, as determined by the RNTI and IMSI. These traces are used in two ways according to their purpose.
- ➍ Training and classification. With a dataset of traces and ground truth for the applications used over time in the dataset, the framework trains a classifier. Given a trained classifier, the framework queries the classifier to determine what applications are responsible for the observed traces. We first identify the class of the application and then identify individual apps subsequently.
In this way, we use the trained classifier in order to fingerprint mobile apps by analyzing the DCI messages collected from a sniffer. In addition to the capability of fingerprinting mobile apps in the framework, we implemented history and correlation attacks. We will present the details of the framework in the following sections.
IV. DATA ACQUISITION AND PILOT STUDY
The very first step of the fingerprinting attack is collecting data that will later be used in the machine learning component. Our attacking framework uses side-channel leaks in DCI messages (Section II-A), such as sizes of the payload and intervals between consecutive messages, as features for classification. In the rest of this section, we will detail how the framework collects and decodes DCI messages, as well as which mobile apps to include in our study.
A. Selecting Mobile Apps
We select nine popular mobile apps from three categories that are representative of common mobile activities: streaming, messaging, and VoIP. Since video streaming is a common target of traffic differentiation [31], VoIP and IM are social connection inferable apps. For streaming, we picked Netflix, YouTube, and Amazon Video; For messaging, we picked Facebook Messenger, WhatsApp, and Telegram; And Facebook Call, WhatsApp, and Skype were selected for VoIP. At the time of writing, these apps topped the charts in their corresponding categories on Google Play Store. Note that our attack is not specific to Android apps, since these apps all have counterparts on other mobile platforms, such as iOS.
B. Gaining Insights from Observations
Any data-driven methods require a comprehensive understanding of data characteristics and recognition of key patterns derived from these characteristics. To this end, for our selected mobile apps, we conduct controlled experiments to collect the traffic over LTE physical channels in a lab setting where variables can be manipulated and monitored. For each app, we manually created Application-Layer sessions using the following approach:
- Streaming apps. We pick several different videos and play each video for 10 minutes.
- Messaging apps. We send and receive text messages, files, voices, and emoticons for 10 minutes. These actions are automatically performed by Auto Clicker [32].
- VoIP apps. We play a piece of music or a speech for 10 minutes.
Streaming apps. These mobile apps generally use existing Application Layer protocols, such as Real-Time Streaming Protocol (RTSP), Dynamic Adaptive Streaming HTTP (DASH), and Real-Time Messaging Protocol (RTMP) [33]. As a result, they segment their content at the Application Layer. We could spot traffic patterns and the impact of these protocols. For example, in the case of Netflix, frame sizes distribute almost uniformly between 0 and 4000 bytes, and the intervals between traffic bursts are relatively long. In the cases of Amazon Prime Video and YouTube, we observe a more continuous frame transmission pattern with much shorter intervals between bursts (if there are any). Compared with traffic patterns of other mobile apps, video streaming apps seem to use much more radio resources at the beginning of each session (intuitively, due to video buffering).
Messaging apps. Intuitively, the traffic patterns of instant messaging (IM) apps are of a dynamic nature, since users at both ends of a chat have full control over what messages and media files to send when to send them, etc. We could observe that IM apps tend to close a session (in the Application Layer) if neither end of a chat sends anything for some time (usually a few or tens of seconds) to save resources. When the Application-Layer session is closed, the old RNTI may timeout; Once the chat is resumed and a new Application-Layer session is re-established, a new RNTI is assigned in the Physical Layer of LTE. As a result, the use of IM apps usually involves a more frequent changing of RNTIs 2 .
VoIP apps. This class of apps usually involves a continuous transmission and a more constant usage of radio resources throughout their sessions. Further, VoIP apps are the only class of mobile apps with a significant and similar amount of data transmitted in both directions (uplink and downlink). Since mobile VoIP calls are usually bidirectional communication, this observation is reasonable.
C. Configuring Devices for Collecting Data
Realizing that different categories of mobile apps have vastly different traffic patterns (at least in a lab setting), we continued to pursue our research by performing data collection in more realistic settings. In the lab setting, we used a commercial off-the-shelf (COTS) radio device (USRP B210 [34]) and a programmable SIM card [35]. We utilized 5 different UEs to collect the traffic: Google Pixel 3XL (Android Pie), Samsung Galaxy Note 8 (Android Pie) and 10+ (Android 10), Motorola E5 (Android Pie), and iPhone11 pro (iOS13). For the real-world setting, we used a pre-paid SIM card for each of the major US mobile carriers: Verizon, AT&T, and T-Mobile. We use a server (Intel Core i7-4760 3.6GHz with 32 GB RAM) with Ubuntu Server 18.04 LTS. Once the UE established a connection with an eNB, we followed the same traffic-generation strategy as described in Section IV-B to generate and collect traffic.
V. DATA PREPROCESSING
To generate fingerprints and train the model, we must select features from the network traffic. We extracted features from the collected data frames by leveraging the subset tool of open source srsLTE, pdsch ue [36]. From the perspective of distinction in traffic, we expect the traffic to show different sizes and intervals of the frames depending on the behavior of the apps and their communication with back-end servers. For instance, streaming apps such as Netflix maintain the session for a certain period of time with buffering time on both the server- and client-side. However, IM apps have very different sizes and intervals from streaming services. To account for the fact that apps show a different behavior, we focus on the size and time variables of the decoded DCI messages.
2We used input automation software to create continuous chat sessions to collect data for avoiding RNTI refreshes. It could not be realistic but for detection purposes, we adopt this mimicking method
TABLE II: Selected features for the classifier
| Type | Features |
|---|---|
| Time vector | Interarrival time, Cumulative time |
| Size vector | Frame size (block size) |
| Direction vector | Uplink, Downlink |
| Identity vector | RNTI |
Accordingly, we select the features from decoded traffics as shown in Table II. Interarrival time refers to the time difference between the arrival of the frame and then the arrival of the next frame. Cumulative time refers to the sum of interarrival time. Frame size is the size (in bytes) of one frame which is defined as Transport Block Size (TBS) in decoded LTE PDCCH, and it is the same size as the payload in the data link layer. The uplink and downlink features are used for identifying the relations between two callers. Suppose the sender sent a specific amount of data at a certain time and the receiver received an equal amount at that time, then we can assume they communicated at that time.
To train our classifier, we create a labeled dataset (trace group) by running selected apps on UEs, detecting the RNTI within the PDCCH DCI data traces, and associating the corresponding DCI trace with a label that identifies the app. We made this labeling possible by identifying RNTIs from the traffic that we generated by the UE so that it could be identified among all other users. This trace grouping process is also applied to the classification attack phase except for labeling.
VI. TRAINING AND CLASSIFICATION
Three major classes of apps show different patterns based on the frame size and its frame time. The identification of apps from traffic is a classification problem where the adversary gathers labeled traffic traces of candidate apps for a training set to later test against unlabeled network traffic traces. The buffer size for rendering, the feature of the video codec, and radio configurations could impact these patterns [12]. To adapt to this dynamic nature, we must use machine learning algorithms to build a classifier.
To build a classifier from the recorded datasets, we used Random Forests (RF) [37] and the Weka open-source machine learning software [38]. RF handles multi-dimensional data in complex and nonlinear relationships between features and is relatively fast to train to be easily scaled to handle large datasets. For additional details, we provide a benchmark for learning classifiers in Section VIII-D to explain why we prefer the RF over other algorithms. To assure the practicality of our framework in real-world settings, we consider asynchronous sessions, where the machine learning algorithm has no knowledge about where the sessions in the trace begin and end. Each session is split using a time window size (msec) and moved to the next frames from the beginning of the session with a certain time frame. We set the time window as 100 ms empirically and aggregate the frames in each window.
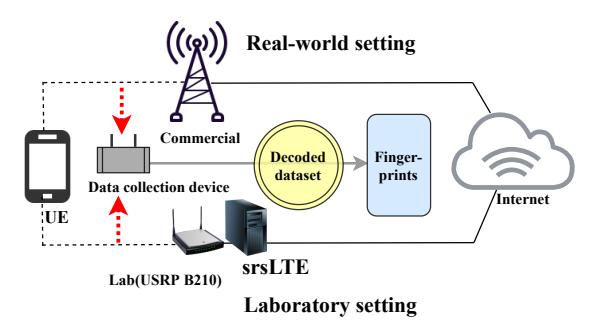
Fig. 4: Experimental setup for lab and real-world settings.
We tested for deriving the optimal window size which helps us to decide the value of the parameter in the performance of the model. Through this splitting procedure using sliding windows, we obtain the synchronization points where each session presents patterns similar to the classifier. Retraining the classifier. Traffic patterns of a mobile app may change over time and deviate from the original pattern as collected for training. As such, we may train and update the classification model in an adaptive manner if the trace is unclassified or incorrectly classified for the same activity. Likewise, if the trace is detected with a low F-Score due to the introduction of a new carrier, a new eNB, or a new mobile app, the trace will be transferred to the Training and Learning phase to adopt it. We discuss this retraining issue as updating cost in Section VII-D.
VII. EVALUATION
Ethical consideration. We used the Faraday cage [39] to block the radio signal between our experimental lab setting and the commercial LTE networks. Thus, our experiments did not cause any disruption to the live LTE networks or mobile devices other than the ones used for our evaluation, as wireless signals were blocked from reaching unsuspecting UEs of realworld users. The real-world experiments required our UEs to communicate with the base stations of the commercial mobile providers, but this communication was done using standard, unmodified UEs and followed normal LTE protocols. We ran no base station in the real-world experiment, only a passive sniffer to capture the traffic between UEs and the providers' base stations. Additionally, our Institutional Review Board (IRB), which oversees research integrity and ethics, requested that we only stored data from our own UEs, and discard data from other UEs. We accomplished this by filtering for the RNTIs used by our UEs. While this reduces the types of measurements we can make from the dataset, it ensures that the private data of users uninvolved in (and fundamentally unable to consent to) the experiment is protected.
Lab vs. Real-world settings. We evaluate our attacks in two different environments: the lab setting and the real-world setting. The former setting used our own self-configured LTE base station (eNodeB), and our own UEs. As a result, we have a high level of control over this experiment, which is useful for verifying the proper functionality of our implementation and the efficacy of our approach. Additionally, since this dataset contains no data of real users (even in encrypted form), we can release this dataset to aid the work of future researchers.
In comparison, the real-world setting is based on traffic captured from live commercial mobile networks of three major US mobile carriers: Verizon, AT&T, and T-Mobile. We registered our own commercial UEs on these networks and measured our system's ability to perform the described attacks on these UEs. Figure 4 illustrates the components for both the tests in the lab setting and the real-world settings.
Data collection. In order to capture and decode the LTE handshake (PDCCH), we customized the pdsch ue module of the open-source LTE software tool srsLTE [36]. Then, we extract frame metadata, including timestamp and total block size in bytes, from the decoded traffic. This is purely a decoding (not decryption) task, using standard LTE protocol decoding tools. The two extracted values are then used to generate the time series as described in Section V. This data collection procedure is repeated 10 times for a total of over 3,000,000 instances for Streaming, Messaging, and VoIP apps. The selected mobile apps are listed in Section IV-A
Building the training dataset. To build a labeled training dataset in the lab and the real-world setting, we generated mobile-app traffic using our UEs and repeatedly captured traffic. For each app, we used up to 350,000 samples in both the lab and real-world settings, capturing the traffic of each app for the duration of 10 minutes per trace. Network traces for each of the interactions were collected separately for 6 months per group.
Traffic patterns and frame metadata are sensitive to operatorspecific configuration, such as the specific resource scheduling algorithms that eNodeBs use, which affect the radio resource allocation. Therefore, we build datasets and train our framework for each mobile network operator in a real-world setting.
Data drift in LTE traffic. We see that the properties of network traces change over time and that different geographically-located base stations have their own settings such as microcells and macrocells. Therefore, it is necessary to update the data set periodically to maintain successful attack performance. We discuss the implications of this on real-world uses of these attacks in Section VII-D and VIII.
A. Mobile-app Fingerprinting Attack
- 1) The Laboratory Setting: Table III shows the classification result in the lab setting. The F-Score shows 98% to 99% accuracy for Streaming apps, 93% to 95% for Messaging apps, and 97% to 99% for VoIP apps. This means our classifier can reliably recognize mobile apps only based on data readily available in LTE physical channels. Consequently, we will proceed with our fingerprint attack on a commercial network setup, which will illustrate how fingerprinting attacks can be executed in a real-world scenario.
- 2) The Real-world Setting: The commercial mobile network exhibits a dynamic and evolving nature [40], which may significantly affect the features that our classifier relies on. We discuss the various type of real-world factors (time,
TABLE III: Mobile app classification results in the laboratory setting with Random Forest. The results of a classification in the controlled environment show that we can fingerprint the application running on the target mobile device with high accuracy by capturing wireless signals.
| Category | Mobile Apps | Down+UP | Down (1) | UP (0) | |||||||
|---|---|---|---|---|---|---|---|---|---|---|---|
| F-Score | Precision | Recall | F-Score | Precision | Recall | F-Score | Precision | Recall | |||
| Streaming | Netflix | 0.991 | 0.991 | 0.996 | 0.991 | 0.991 | 0.991 | 0.989 | 0.990 | 0.988 | |
| YouTube | 0.996 | 0.995 | 0.996 | 0.996 | 0.995 | 0.996 | 0.995 | 0.994 | 0.995 | ||
| Amazon Prime | 0.988 | 0.988 | 0.988 | 0.988 | 0.988 | 0.988 | 0.987 | 0.986 | 0.987 | ||
| 0.949 | 0.966 | 0.932 | 0.950 | 0.968 | 0.933 | 0.873 | 0.929 | 0.824 | |||
| Messenger | 0.952 | 0.945 | 0.959 | 0.934 | 0.923 | 0.944 | 0.941 | 0.930 | 0.954 | ||
| Telegram | 0.931 | 0.929 | 0.933 | 0.917 | 0.907 | 0.917 | 0.903 | 0.901 | 0.906 | ||
| VoIP call | 0.975 | 0.971 | 0.979 | 0.973 | 0.974 | 0.972 | 0.973 | 0.972 | 0.975 | ||
| 0.986 | 0.988 | 0.983 | 0.984 | 0.985 | 0.984 | 0.985 | 0.986 | 0.983 | |||
| Skype | 0.996 | 0.996 | 0.996 | 0.995 | 0.995 | 0.996 | 0.996 | 0.996 | 0.996 |
TABLE IV: Mobile app classification results in a real-world setting (Downlink Only) with Random Forests. In real mobile networks, precision, recall, and F-score values decrease by 5 - 30%. Nevertheless, we can still identify the apps with sufficient confidence.
| Category | Mobile Apps | Verizon F-Score Precision Recall |
F-Score | AT&T Precision |
Recall | T-Mobile F-Score Precision Recall |
||||
|---|---|---|---|---|---|---|---|---|---|---|
| Streaming | Netflix | 0.818 | 0.821 | 0.815 | 0.811 | 0.821 | 0.801 | 0.811 | 0.809 | 0.814 |
| YouTube | 0.789 | 0.799 | 0.798 | 0.793 | 0.789 | 0.798 | 0.798 | 0.801 | 0.795 | |
| Amazon Prime | 0.854 | 0.852 | 0.856 | 0.858 | 0.862 | 0.854 | 0.858 | 0.869 | 0.847 | |
| Messenger | 0.841 | 0.841 | 0.842 | 0.840 | 0.853 | 0.827 | 0.829 | 0.833 | 0.826 | |
| 0.791 | 0.794 | 0.789 | 0.790 | 0.792 | 0.789 | 0.789 | 0.794 | 0.784 | ||
| Telegram | 0.748 | 0.751 | 0.746 | 0.748 | 0.749 | 0.747 | 0.747 | 0.749 | 0.746 | |
| VoIP call | 0.901 | 0.900 | 0.902 | 0.839 | 0.891 | 0.895 | 0.911 | 0.912 | 0.911 | |
| 0.794 | 0.799 | 0.789 | 0.791 | 0.789 | 0.794 | 0.779 | 0.780 | 0.778 | ||
| Skype | 0.866 | 0.877 | 0.855 | 0.863 | 0.871 | 0.855 | 0.854 | 0.851 | 0.858 |
TABLE V: History attack results showing the duration of traffic capture, F-score, and correctness of the classification. From the empirical observation, the prediction results become unstable if the F-score falls below 70%.
| Location | Date | Start Time | End Time | Duration | Categories | F-score | Prediction | Result |
|---|---|---|---|---|---|---|---|---|
| Zone A' | 05/08/2022 | 15:00:08 | 15:06:07 | 0:05:59 | Streaming apps | 85.35% | Netflix | TRUE |
| Zone B' | 05/08/2022 | 15:30:10 | 15:35:25 | 0:05:15 | Messaging apps | 67.32% | Telegram | FALSE |
| Zone C' | 05/08/2022 | 17:10:08 | 17:18:05 | 0:07:57 | VoIP apps | 85.35% | Netflix | TRUE |
| Zone A' | 05/08/2022 | 17:25:55 | 17:35:52 | 0:09:57 | Streaming apps | 85.54% | YouTube | TRUE |
| Zone B' | 05/08/2022 | 18:12:25 | 18:18:06 | 0:05:41 | Messaging apps | 78.12% | TRUE | |
| Zone A' | 05/09/2022 | 11:10:52 | 11:16:51 | 0:05:59 | VoIP apps | 72.12% | TRUE | |
| Zone B' | 05/09/2022 | 12:00:08 | 12:06:07 | 0:05:59 | Messaging apps | 78.12% | Netflix | TRUE |
| Zone C' | 05/09/2022 | 12:35:25 | 12:41:17 | 0:05:52 | Streaming apps | 69.65% | Amazon | FALSE |
| Zone A' | 05/10/2022 | 17:12:16 | 17:22:00 | 0:09:44 | Streaming apps | 88.12% | YouTube | TRUE |
| Zone B' | 05/10/2022 | 17:32:16 | 17:39:26 | 0:07:10 | VoIP apps | 66.45% | Skype | TRUE |
| Zone A' | 05/10/2022 | 18:15:00 | 18:21:11 | 0:06:11 | Messaging apps | 90.52% | TRUE | |
| Zone A' | 05/10/2022 | 18:25:00 | 18:31:26 | 0:06:26 | Streaming apps | 89.41% | Netflix | TRUE |
multiple apps, handover, and location) which can affect the accuracy of the classifier in Section VIII. Table IV shows experimental results, where the F-Scores for all classes of mobile apps: 79% to 86% for Streaming apps, 74% to 84% for Messaging apps, and 77% to 91% for VoIP apps. As expected, the classification performance is lower than in lab settings, and we observe noticeable drops in F-Scores (around 5 to 10 percentage points). However, even with this efficacy reduction, application fingerprinting remains relatively robust.
B. History Attack
To evaluate the history attack, we set up a radio monitoring environment (Figure 2) on the T-Mobile network (Figure 5 depicted by Cellmapper [41] which is a crowd-sourced cellular tower and coverage mapping service). Each data collection device (sniffer) records and decodes traffic within each cell zone (attack zone). In the experiment, the UE roamed (handover) between cells, and the victim used different apps for at least 10 minutes within each cell zone. As discussed earlier, we tracked only the UEs directly associated with our experiment. Afterward, we integrated all collected traffic into one dataset, which was then used for mobile-app fingerprinting and location tracking of UEs.
Table V shows experimental results. We attempted a history attack 12 times in total over 3 days and successfully detected
TABLE VI: Similarity scores (D(Tw, Ta)) of the captured traffic traces. The mean values show how close the traffic pairs are similar.
| Messaging | VoIP | ||||||||||||
|---|---|---|---|---|---|---|---|---|---|---|---|---|---|
| Telegram | Facebook Call | WhatsApp Call | Skype | ||||||||||
| Mean | STD-DEV | Mean | STD-DEV | Mean | STD-DEV | Mean | STD-DEV | Mean | STD-DEV | Mean | STD-DEV | ||
| Lab | 0.850 | 0.131 | 0.862 | 0.129 | 0.750 | 0.125 | 0.896 | 0.085 | 0.886 | 0.085 | 0.930 | 0.128 | |
| AT&T | 0.754 | 0.088 | 0.772 | 0.089 | 0.654 | 0.091 | 0.724 | 0.066 | 0.754 | 0.064 | 0.643 | 0.080 | |
| T-Mobile | 0.716 | 0.082 | 0.736 | 0.086 | 0.688 | 0.063 | 0.696 | 0.059 | 0.741 | 0.096 | 0.676 | 0.091 | |
| Verizon | 0.692 | 0.100 | 0.652 | 0.077 | 0.634 | 0.095 | 0.672 | 0.057 | 0.782 | 0.099 | 0.610 | 0.052 | |
| Average | 0.721 | 0.085 | 0.730 | 0.078 | 0.653 | 0.082 | 0.697 | 0.075 | 0.759 | 0.088 | 0.642 | 0.083 |
TABLE VII: Precision and recall values for the similarity classification in correlation attacks. The values are the results of classification through logistic regression. VoIP apps are easier to identify contact between users.
| Messaging | VoIP | |||||||||||
|---|---|---|---|---|---|---|---|---|---|---|---|---|
| Telegram | Facebook Call | WhatsApp Call | Skype | |||||||||
| Precision | Recall | Precision | Recall | Precision | Recall | Precision | Recall | Precision | Recall | Precision | Recall | |
| Lab | 0.891 | 0.833 | 0.865 | 0.834 | 0.975 | 0.961 | 1.000 | 0.980 | 0.993 | 0.937 | 1.000 | 0.994 |
| AT&T | 0.726 | 0.697 | 0.659 | 0.637 | 0.734 | 0.694 | 0.698 | 0.689 | 0.736 | 0.725 | 0.792 | 0.766 |
| T-Mobile | 0.728 | 0.727 | 0.773 | 0.761 | 0.773 | 0.767 | 0.774 | 0.750 | 0.869 | 0.846 | 0.736 | 0.738 |
| Verizon | 0.814 | 0.825 | 0.727 | 0.699 | 0.788 | 0.792 | 0.756 | 0.767 | 0.774 | 0.767 | 0.716 | 0.719 |
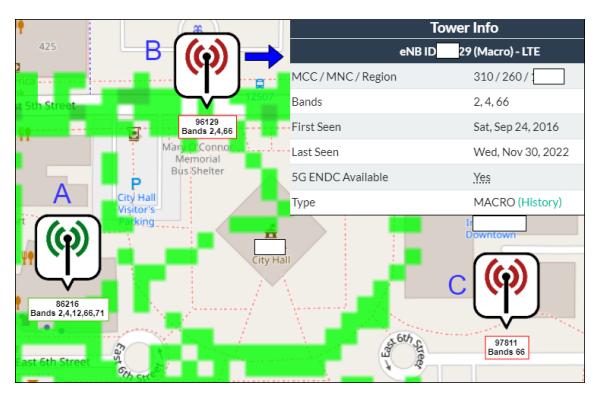
Fig. 5: History attack setup on T-Mobile Network.
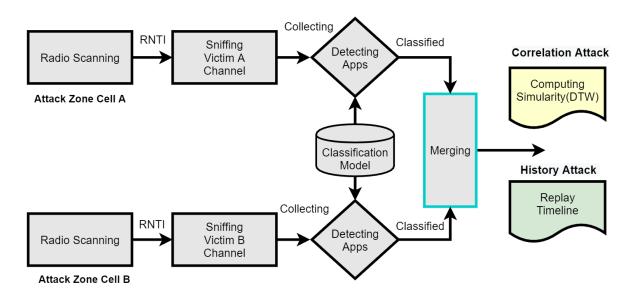
Fig. 6: Privacy attack procedure.
all mobile apps used in 10 of those cases, achieving an 83% success rate. Our results confirmed that through the history attack, an attacker may obtain another user's private information, such as their per-location app usage, with high confidence and without being noticed by the victim.
C. Correlation Attack
As described previously in Section III-D, the attacker may use the captured LTE traffic patterns that he collected from different UEs to identify relationships between users (i.e., correlation attack). Figure 6 shows three consecutive steps in our correlation attack. (1) Radio Scanning scans the broadcast channel to identify the victim's radio information, (2) App Detection uses a hierarchical classification method based on Random Forest, and (3) Similarity Calculation uses the Dynamic Time Warping (DTW) algorithm as a distance metric to compare recorded traces [42].
To use DTW in our analysis, we generated 10 VoIP and instant messaging traffic traces for each pair of metadata to measure the similarity in both lab and real-world settings, where Tw being the time threshold to be considered in the calculation as a unit of traffic, and Ta as the number of frames in a time window. By default, we set Tw to 1 second. After creating a cost matrix, DTW compares the two-time series data using Euclidean distance, represented as d(D(Tw, Ta)), and finds the similarity value D(Tw, Ta) using the Equation (1):
\(D(T_w, T_a) = d(T_w, T_a) + min \begin{cases} D(T_w - 1, T_a - 1), \\ D(T_w - 1, T_a), \\ D(T_w, T_a - 1) \end{cases}\) (1)
Table VI summarizes similarity scores (i.e., D(Tw, Ta)) for predicting users' relationships in both the laboratory setting and the real-world setting. Under each set, we run the experiment 10 times for each mobile app. We see that our attacks were largely successful with similarity scores ranging from 0.61 to 0.93. The results show that traffic traces can be used to reliably detect contact between users.
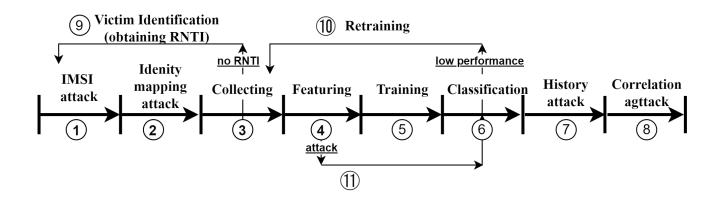
Fig. 7: Structuring adversary cost.
After comparing similarity scores between different mobile apps, we found that apps generating lower volumes of traffic usually had low similarity scores. To achieve better correlation attack results, we must collect a sufficient amount of traffic, which may take longer for apps that generate less traffic.
We also tried adjusting the time window to measure the effect of smaller samples on the classification. We found that when the time window shrinks, the similarity score increases until the time window reaches a certain threshold. Hence, we can determine the optimal value for the time window for each app. When we get an optimal time window value, we set it as the new default value for optimizing the DTW calculation. This way we iterate through a sequence of optimal values for the time window and improve the similarity measurement.
However, the similarity of traffic traces alone does not guarantee the correlation between the two users; It only shows the similarity of two independent traffic traces. In other words, it does not prove that the two users are communicating using the same mobile application. In addition to matching the two traffic traces using DTW, we leveraged logistic regression [43] and determined whether the matched traffic traces belong to traces of certain applications.
Table VII shows the precision and recall values of our logistic regression model in the lab and real-world settings. We collected the similarity values from both our lab and real-world environments. We collected data from each app in our controlled network environment using our own eNodeB. For the real-world data, we collected data from commercial mobile network companies including AT&T, T-Mobile, and Verizon.
Facebook Call and Skype results under the lab setting show a 100% precision, which means that the model exhibits 100% true positive and 0% false positive rates. Despite the high true positive rates, other values, especially the recall values, are lower than 70%, implying that the model fails to classify many instances of contact between users. While we expect that the overall accuracy of the model would increase if trained on a larger dataset of similarity, we stress that, given high precision, an attacker just "needs to get lucky once" in detecting a connection between users over time.
D. Analytical Attacker Cost Model
Based on Figure 7, we build the analytical cost model of an attacker to sustain an attack performance and describe the scenarios in a holistic investigation. We will skip 1, 2, 7, 8, 9, and 1) as common costs, while we will break down the fingerprinting attack cost for each task.
Collecting cost ③: In real-world considerations, we discussed in Section VIII, the attacker may want to train the dataset with reference to the time and size of the multiple and background traffic. If we indicate the number of training apps by $A_t$ , and assume that apps have $A_v$ versions that are different enough to diminish the classifier's performance, the number of apps the attacker needs to record is $A_n = A_t \times A_v \times A_i$ , where $A_i$ is the number of instances per app. We indicate the data recording cost as $Col_{cost}(A_n)$ .
Training Cost (5): The training cost is to train the classifier with the collected data, which includes the cost of measuring features $F_m$ and training a classifier $T_c$ . Hence the cost of training is $Train_{cost}(A_n, F_m, T_c)$ . If $T_s$ indicates the cost of training with a single instance of a traffic trace, then the cost of training the system could be $Train_{cost}(A_n, F_m, T_c) = A_n \times T_s$ .
App identification cost ④, ⑥: For identifying the app, the attacker should record test data $T_d$ , measure features $F_m$ , and classify using the classifier $T_c$ . Let $V_n$ indicate the number of targeted victims and $A_a$ indicate the average number of apps run by each victim. Then the amount of test data is $T_d = V_n \times A_a$ . The total testing cost could be $Col_{cost}(T_d) + Id_{cost}(T_d, F_m, T_c)$ .
Retraining Cost (10): To keep the performance of the classifier, the attacker should retrain the classifier over time. If the attacker would keep the performance of the classifier above a threshold X, the retraining costs contain the cost of training the data $(A_n)$ , measuring the features $F_m$ and training the classifier $(T_c)$ , which is denoted as $Retrain_{cost}(A_n, F_m, T_c)$ . If on average, apps change D day periods, the daily updating cost is $Retrain_{cost}(A_n, F_m, T_c)$ /D. In order to reflect the daily change in the traffic patterns of mobile apps, the attacker trains the classifier daily for up to D days. Then, the overall cost of an attacker to keep an attack performance:
\[Perf(A_n, F_m, T_c, T_d) = Col_{cost}(A_n)\] \[+ Train_{cost}(A_n, F_m, T_c)\]\(+ Col_{cost}(T_d) + Id_{cost}(T_d, F_m, T_c)\) (2)
If the performance falls down under the threshold X in D days and the attacker should retrain the dataset as described in Equation 3.
\[Cost(A_n, F_m, T_c, T_d)\] \[= Perf(A_n, F_m, T_c, T_d)\]\(\begin{cases} +\sum_{1}^{D} (Retrain_{cost} / D), & \text{if } Perf() < X \\ +0, & \text{otherwise} \end{cases}\) (3)
For example, in Figure 8, the performance degrades by less than 70% in seven days, so the attacker needs to retrain the classifier at this point to maintain the performance. Retraining the model for D days for keeping the performance could be expensive for the attackers depending on his aiming.
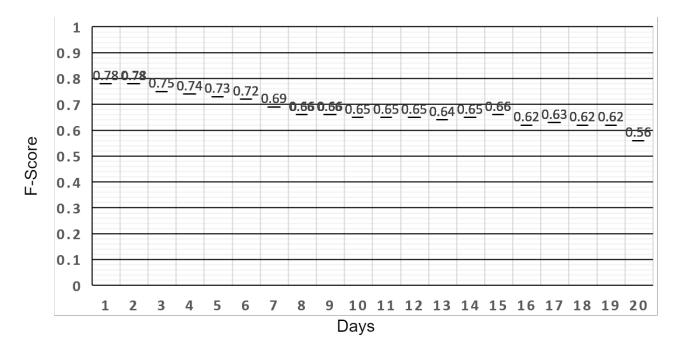
Fig. 8: Decrease in performance over time.
VIII. DISCUSSION
A. Real-world Considerations and Limitations
Time effect: Mobile apps are constantly updating critical fixes or feature improvements. This is reflected in the traffic traces and accordingly in the performance of the attacks. The critical effect of time in the performance represents a challenge to the adversary who should train the classifier on a regular basis. Depending on the performance that an attacker aims to keep, the cost of training may be different and we evaluate this cost in Section VII-D. To measure the effect of time, we run the experiment by training a classifier with traces of the mobile apps recorded at the time (day) t = 1 for 10 minutes and test it using traces recorded within 20 days of the mobile apps. Figure 8 shows the result of the experiment with the F-Score measured for the classifier for streaming mobile apps (T-mobile, YouTube) over the same apps on different days. For the rest of the mobile apps, we observed similar drops in performance.
Impacts of noise traffic: It is highly probable that the UE operates numerous other apps simultaneously in real-world usage. Thus we consider this case as noise traffic and attempt to measure the impact of this noise traffic by increasing the number of running apps. We evaluate the impact on the performance when trained on a single running app and tested on traces recorded under multiple apps and background apps. In order to simulate this environment, we run a single app (YouTube on T-Mobile) while running the apps in the background sequentially. We run the 5 to 10 apps in the background with a delay of 3-4 seconds which were chosen randomly from the Google store's top 10 free apps including the 9 apps we selected for fingerprinting. In this way, we created datasets of 5 different sizes (10, 20, 30, 40, and 50 K instances) which are used for comparing with the trained classifier. Then we train the classifier using a single app trace for 10 minutes and test it with the multiple apps' traces we recorded. As shown in Figure 9, we observe a drop in the F-Score while we increase the size of the dataset by running multiple background apps. When we increase the amount of background traffic by 10 K instances, there is a drop in performance with the range of 3% to 13%, and when the effective performance is assumed to be 0.6, if the instance increases more than 30K instances, it may be impossible to identify. Accordingly, our proposed attack reveals a limitation
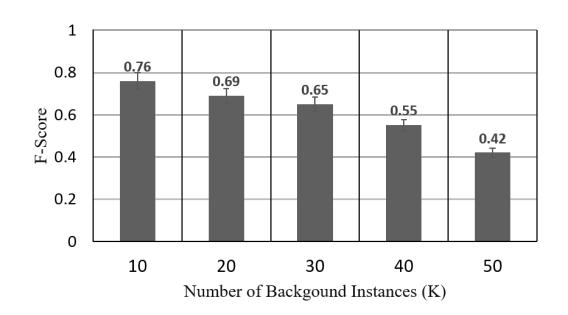
Fig. 9: Impact of noise traffic.
where the presence of noise may impede the effectiveness of the attack results. In another scenario where multiple UEs are concurrently using the same apps within the same cell coverage area, there is a possibility that it could result in higher levels of noise traffic at the radio layers. However, the traffic we collect and train is exclusively obtained from a single targeted UE, which is filtered through RNTI-based techniques. Consequently, our attacks are not influenced by the interference resulting from multiple UEs executing identical applications concurrently or any increase in the number of UEs. (see Section III-A Threat Model).
Handover case: In a real-world setting, there may be extra costs, technical issues, and inconsistencies that may inhibit the time-demanding traffic sniffing. In the case of the handover scenario, we already showed the feasibility of the trace in history attack in Section VII-B based on the assumption of the threat model leveraging IMSI catcher and identity mapping attacks. In another scenario, switching off the victim's smartphone may not use an LTE data connection but instead Wi-Fi or even downgrade to 3G. In other words, the user's radio resource usage pattern may not be detected by this attack. When the attacker tries to create a dataset for the different radio technologies, our approach should be redesigned with the corresponding radio interface and customized with a machinelearning model.
B. Countermeasures
Because our privacy attacks rely on tracking the temporal ID (RNTI) of the victim, a frequent reassignment of the RNTI from the base station can disrupt the tracking and collecting of LTE traffic. Obfuscating approaches of the traffic characteristics at layer two also can be implemented to prevent revealing similarities [44]. Also, pre-existing works in the anonymity network approach [45] could be deployed if they are suitable for use in mobile networks. Although this technique can mitigate the effectiveness of the traffic fingerprint, generally obfuscating traffic imposes high-performance overhead on data transmission, and thus, is difficult to apply in practice. Bae at al. [9] proposed and implemented to modify eNodeB enforcing the encryption of the connection procedure to hide the RNTI. However, the additional messages and performance overhead remained for adoption in commercials.
C. Extension to 5G
There are significant changes in the radio layer of the 5th generation mobile networks (5G) to support various types of radio applications (e.g., e-health, automotive, public safety, and smart grids) [46]. To guarantee the quality of the service, the 5G application requires a dedicated virtual network service. However, in the case of the end user, even though the radio technologies are different, the high-level behavior of the application is not influenced. Due to the different frequency and radio channel technologies, we could equip the proper device to support the radio spectrum to apply our framework. Also, 5G adopts a new protection mechanism, a globally unique Subscription Permanent Identifier (SUPI) and Subscription Concealed Identifier (SUCI) [47], to prevent the exposure of subscriber's identifier such as IMSI which used to be mapped to the identity of the subscriber. Therefore, we would need to study the correlation methodology with SUPI/SUCI for collecting a specific user's traffic.
D. Benchmark for Learning Classifiers
We compare the performance against various supervised learning algorithms to determine the effectiveness of the classifier and ensure which classifier is effective in our approach. We identified the optimal hyperparameters for each algorithm and present only the results obtained using these selected hyperparameters. A weighted accuracy is used to measure their performance on the same dataset. We selected four algorithms, namely Logistic Regression (LR), k-Nearest Neighbors (kNN), Convolutional Neural Networks (CNN), and Random Forest (RF), for our evaluation. To create the dataset, we mixed the apps from each of the three classes (Streaming, Calling, Messenger), based on real-world deployments. The results including details on the configuration parameters and implementation of the benchmark classifiers can be found in Table VIII. Based on the weighted average of accuracy values, we can see that the RF model performed the best, with an accuracy of 0.821. The kNN model performed the second best, with an accuracy of 0.735. The LR model performed the third best, with an accuracy of 0.698, and the Convolutional Neural Network model performed the worst, with an accuracy of 0.677. The main limitation of LR is the assumption of linearity between the dependent variable and the independent variables. In our work, the data is rarely linearly separable. However, the relationship between input and output is nonlinear. We use the cross-validation to determine optimal k for kNN model. Thus we perform an iterative process whereby we train and test the model across a range of k values, from 1 to 10. For each k value, we calculate the accuracy of the model. Ultimately, the optimal k value is chosen as 4 based on the highest accuracy achieved on the test set. kNN revealed that when applied to large datasets, the prediction stage may exhibit signs of reduced processing speed. CNN should keep learning until it comes out with the best set of features to obtain a satisfying predictive performance. Also, neural networks are organized in layers made up of interconnected nodes which contain an activation function that computes the output of the
TABLE VIII: Performance Comparison of Algorithms
| Algorithm | LR | kNN | CNN | RF |
|---|---|---|---|---|
| Streaming | 0.613 | 0.752 | 0.591 | 0.819 |
| Calling | 0.876 | 0.760 | 0.717 | 0.850 |
| Messenger | 0.605 | 0.694 | 0.706 | 0.793 |
| Average | 0.698 | 0.735 | 0.677 | 0.821 |
| Number | Number | |||
| Parameters | C = 1 | k = 4 | of class = 3, | of tree = 100, |
| LF= SCE | Seed = 1 |
- LR: C refers to the inverse of the regularization strength
- kNN: k refers to the number of the nearest neighbors
- CNN: LF (Loss Function) sets SCE (Softmax Cross-Entropy)
- RF: Number of trees sets Cross-validation
- Dataset (real-world): Mixed in equal proportions for each class app
- Streaming 265,599 / Calling 109,692 / Messenger 38,333
- Splitting of the dataset: 80% training, 20% testing
network. It is considerably slower and can become impractical in certain circumstances. In contrast, RF is an ensemble of decision trees where the leaf node represents either the major class for classification problems or the average in the case of regression problems. RF and CNN are different techniques that learn differently but can be used in similar domains. However, RF does not require high-performance hardware such as a GPU and is hence less computationally expensive compared to Neural Networks. From our experience, CNN requires more data and training to predict the results. Since our data is simple tabular data representing the frame size and cumulative time, we prefer RF over CNN due to its efficiency in training and resource consumption. Therefore, we believe the results obtained with the RF classifier are comparable with its more accurate counterpart.
IX. CONCLUSION
The air interface of the LTE is easily overlooked by the operators and attackers regarding privacy leakage. Also, there has been little research regarding applied attacks based on fingerprints using physical side-channel. In this work, we introduce the physical channel fingerprinting method by decoding the LTE traffic captured from the air interface. With the collected dataset from the lab and real-world settings, we built the hierarchical classification model by leveraging sophisticated machine learning techniques. To evaluate the performance and assure its applicability, we designed and implemented the targeted privacy attack framework to perform the History and Correlation attacks in both lab and real-world settings The evaluation result reveals the sufficient performance of the model and attack framework. Moreover, our attack framework is implemented with open-source and affordable cost SDR devices to be practically adapted to anyone.
ACKNOWLEDGMENT
This work was partially supported by the grants from National Science Foundation (NSF-CICI-2232911) and Institute for Information & Communications Technology Promotion (IITP-MSIT-2017-0-00168).
REFERENCES
- [1] Comparitech. (2022) Screen time statistics: Average screen time in us vs. the rest of the world. [Online]. Available: https: //www.comparitech.com/tv-streaming/screen-time-statistics/
- [2] T. Guardian. (2021) Us church official resigns after news outlet uses phone data to out him as grindr user. [Online]. Available: https://www.theguardian.com/us-news/2021/jul/21/ church-official-resigns-grindr-use-location-data-obtained-the-pillar
- [3] T. van Ede, R. Bortolameotti, A. Continella, J. Ren, D. J. Dubois, M. Lindorfer, D. Choffnes, M. van Steen, and A. Peter, "Flowprint: Semi-supervised mobile-app fingerprinting on encrypted network traffic," 2020.
- [4] 3GPP, "3gpp system architecture evolution (sae); security architecture," TS33.401, 2015, latest release: 17.2.0 (2022-06-17). [Online]. Available: http://www.3gpp.org/DynaReport/33401.htm
- [5] M. Swarnkar, N. Hubballi, N. Tripathi, and M. Conti, "Apphunter: Mobile application traffic classification," in 2018 IEEE International Conference on Advanced Networks and Telecommunications Systems (ANTS). IEEE, 2018, pp. 1–6.
- [6] V. Rimmer, D. Preuveneers, M. Juarez, T. Van Goethem, and W. Joosen, "Automated website fingerprinting through deep learning," arXiv preprint arXiv:1708.06376, 2017.
- [7] J. S. Atkinson, J. E. Mitchell, M. Rio, and G. Matich, "Your wifi is leaking: What do your mobile apps gossip about you?" Future Generation Computer Systems, vol. 80, pp. 546–557, 2018.
- [8] S. Chen, R. Wang, X. Wang, and K. Zhang, "Side-channel leaks in web applications: A reality today, a challenge tomorrow," in 2010 IEEE Symposium on Security and Privacy. IEEE, 2010, pp. 191–206.
- [9] S. Bae, M. Son, D. Kim, C. Park, J. Lee, S. Son, and Y. Kim, "Watching the watchers: Practical video identification attack in lte networks," in 31st USENIX Security Symposium (USENIX Security 22), 2022, pp. 1307–1324.
- [10] K. Kohls, D. Rupprecht, T. Holz, and C. Popper, "Lost traffic encryption: ¨ fingerprinting lte/4g traffic on layer two," in Proceedings of the 12th Conference on Security and Privacy in Wireless and Mobile Networks, 2019, pp. 249–260.
- [11] D. Rupprecht, K. Kohls, T. Holz, and C. Popper, "Breaking LTE on ¨ layer two," in IEEE Symposium on Security & Privacy (SP). IEEE, May 2019.
- [12] Schuster, Roei and Shmatikov, Vitaly and Tromer, Eran, "Beauty and the burst: Remote identification of encrypted video streams," in 26th USENIX Security Symposium (USENIX Security 17), 2017.
- [13] F. Van Den Broek, R. Verdult, and J. de Ruiter, "Defeating imsi catchers," in Proceedings of the 22Nd ACM SIGSAC Conference on Computer and Communications Security, 2015, pp. 340–351.
- [14] A. Shaik, R. Borgaonkar, N. Asokan, V. Niemi, and J.-P. Seifert, "Practical attacks against privacy and availability in 4g/lte mobile communication systems," arXiv preprint arXiv:1510.07563, 2015.
- [15] Z. Li, W. Wang, C. Wilson, J. Chen, C. Qian, T. Jung, L. Zhang, K. Liu, X. Li, and Y. Liu, "Fbs-radar: Uncovering fake base stations at scale in the wild." in NDSS, 2017.
- [16] H. Yang, S. Bae, M. Son, H. Kim, S. M. Kim, and Y. Kim, "Hiding in plain signal: Physical signal overshadowing attack on lte," in 28th USENIX Security Symposium (USENIX Security 19), 2019, pp. 55–72.
- [17] M. Kotuliak, S. Erni, P. Leu, M. Roeschlin, and S. Capkun, "LTrack: ˇ Stealthy tracking of mobile phones in LTE," in 31st USENIX Security Symposium (USENIX Security 22), 2022, pp. 1291–1306.
- [18] A. Sood and R. Enbody, Targeted cyber attacks: multi-staged attacks driven by exploits and malware. Syngress, 2014.
- [19] R. P. Jover, "Lte security, protocol exploits and location tracking experimentation with low-cost software radio," arXiv preprint arXiv:1607.05171, 2016.
- [20] D. F. Kune, J. Koelndorfer, N. Hopper, and Y. Kim, "Location leaks on the gsm air interface," ISOC NDSS (Feb 2012), 2012.
- [21] J. D. Roth, M. Tummala, J. C. McEachen, and J. W. Scrofani, "On location privacy in lte networks," IEEE Transactions on Information Forensics and Security, vol. 12, no. 6, pp. 1358–1368, 2017.
- [22] H. Cheng and R. Avnur, "Traffic Analysis of SSL Encrypted Web Browsing," URL citeseer. ist. psu. edu/656522. html, 1998.
-
[23] J. Ren, A. Rao, M. Lindorfer, A. Legout, and D. Choffnes, "Recon: Revealing and controlling pii leaks in mobile network traffic," in Proceedings of the 14th Annual International Conference on Mobile Systems, Applications, and Services, 2016, pp. 361–374.
- [24] J. Ren, M. Lindorfer, D. J. Dubois, A. Rao, D. Choffnes, and N. Vallina-Rodriguez, "A longitudinal study of pii leaks across android app versions," in Network and Distributed System Security Symposium (NDSS), 2018.
- [25] M. Lindorfer, M. Neugschwandtner, L. Weichselbaum, Y. Fratantonio, V. Van Der Veen, and C. Platzer, "Andrubis–1,000,000 apps later: A view on current android malware behaviors," in 2014 third international workshop on building analysis datasets and gathering experience returns for security (BADGERS). IEEE, 2014, pp. 3–17.
- [26] MathWorks. (2022) Lte toolbox: Ue detection using downlink signals. [Online]. Available: https://www.mathworks.com/help/lte/ examples/ue-detection-using-downlink-signals.html
- [27] Q. Technologies. (2022) Network signal guru. [Online]. Available: https://apkpure.com/network-signal-guru/com.qtrun.QuickTest
- [28] N. Bui and J. Widmer, "Owl: A reliable online watcher for lte control channel measurements," in Proceedings of the 5th Workshop on All Things Cellular: Operations, Applications and Challenges, 2016, pp. 25–30.
- [29] S. R. Hussain, M. Echeverria, O. Chowdhury, N. Li, and E. Bertino, "Privacy attacks to the 4g and 5g cellular paging protocols using side channel information." in NDSS, 2019.
- [30] J. Baek, S. Kyung, H. Cho, Z. Zhao, Y. Shoshitaishvili, A. Doupe, and ´ G.-J. Ahn, "Wi not calling: Practical privacy and availability attacks in wi-fi calling," in Proceedings of the 34th Annual Computer Security Applications Conference, 2018, pp. 278–288.
- [31] F. Li, A. A. Niaki, D. Choffnes, P. Gill, and A. Mislove, "A large-scale analysis of deployed traffic differentiation practices," in Proceedings of the ACM Special Interest Group on Data Communication, 2019, pp. 130–144.
- [32] T. D. Studio. (2022) Auto clicker. [Online]. Available: https: //play.google.com/store/
- [33] YouTube. (2022) Live streaming api. [Online]. Available: https://developers.google.com/youtube/v3/live/guides/ ingestion-protocol-comparison
- [34] N. Instruments. (2022) Usrp software defined radio device. [Online]. Available: https://www.ni.com/en-us/shop/select/ usrp-software-defined-radio-device
- [35] openLTE. (2022) Programming you own usim card. [Online]. Available: https://sourceforge.net/p/openlte/wiki/Programming% 20you%20own%20USIM%20card/
- [36] I. Gomez-Miguelez, A. Garcia-Saavedra, P. D. Sutton, P. Serrano, C. Cano, and D. J. Leith, "srslte: an open-source platform for lte evolution and experimentation," in Proceedings of the Tenth ACM International Workshop on Wireless Network Testbeds, Experimental Evaluation, and Characterization, 2016, pp. 25–32.
- [37] L. Breiman, "Random forests," Machine learning, vol. 45, no. 1, pp. 5–32, 2001.
- [38] U. of Waikato Machine Learning Group. (2022) Weka: Data mining software in java. [Online]. Available: https://www.cs.waikato.ac.nz/ml/ weka/
- [39] G. Instruments. (2022) The faraday cage: What is it? how does it work? [Online]. Available: https://www.gamry.com/application-notes/ instrumentation/faraday-cage/
- [40] P. Kocher, J. Jaffe, and B. Jun, "Differential power analysis," in Annual International Cryptology Conference. Springer, 1999, pp. 388–397.
- [41] Cellmapper. (2022) Crowd-sourced cellular tower and coverage mapping service. [Online]. Available:https://www.cellmapper.net/
- [42] D. J. Berndt and J. Clifford, "Using dynamic time warping to find patterns in time series." in KDD workshop, vol. 10, no. 16. Seattle, WA, 1994, pp. 359–370.
- [43] P. Peduzzi, J. Concato, E. Kemper, T. R. Holford, and A. R. Feinstein, "A Simulation Study of the Number of Events per Variable in Logistic Regression Analysis," Journal of clinical epidemiology, vol. 49, no. 12, 1996.
- [44] C. V. Wright, S. E. Coull, and F. Monrose, "Traffic morphing: An efficient defense against statistical traffic analysis." in NDSS, vol. 9. Citeseer, 2009.
- [45] I. Tor Project. (2022) The tor project: Privacy & freedom online. [Online]. Available:https://www.torproject.org/
- [46] N. Alliance, "5g white paper," Next generation mobile networks, white paper, vol. 1, 2015.
- [47] 3GPP, "System architecture for the 5g system (5gs)," TS23.501, 2017, latest release: 17.5.0 (2022-06-15). [Online]. Available: http: //www.3gpp.org/DynaReport/23501.htm